World’s Busiest Airports: Top 20 Ranking Confirmed by ACI
/https://aviacionlinecdn.eleco.com.ar/media/2023/07/ESTAMBUL-AEROPUERTO-GENERICA-PASAJEROS.jpg)
Airports Council International (ACI), the organization behind the main players in the airport industry worldwide, today published its World Airport Traffic Dataset, in which it confirms the ranking of the top 20 airports with the most passenger, cargo, and airport movement in 2022.
In total, the airport industry mobilized 6.6 billion passengers in 2022, a growth of 43.8% compared to 2021, which in turn represents a recovery of 72.5% of the traffic levels of 2019, prior to the outbreak of the pandemic.
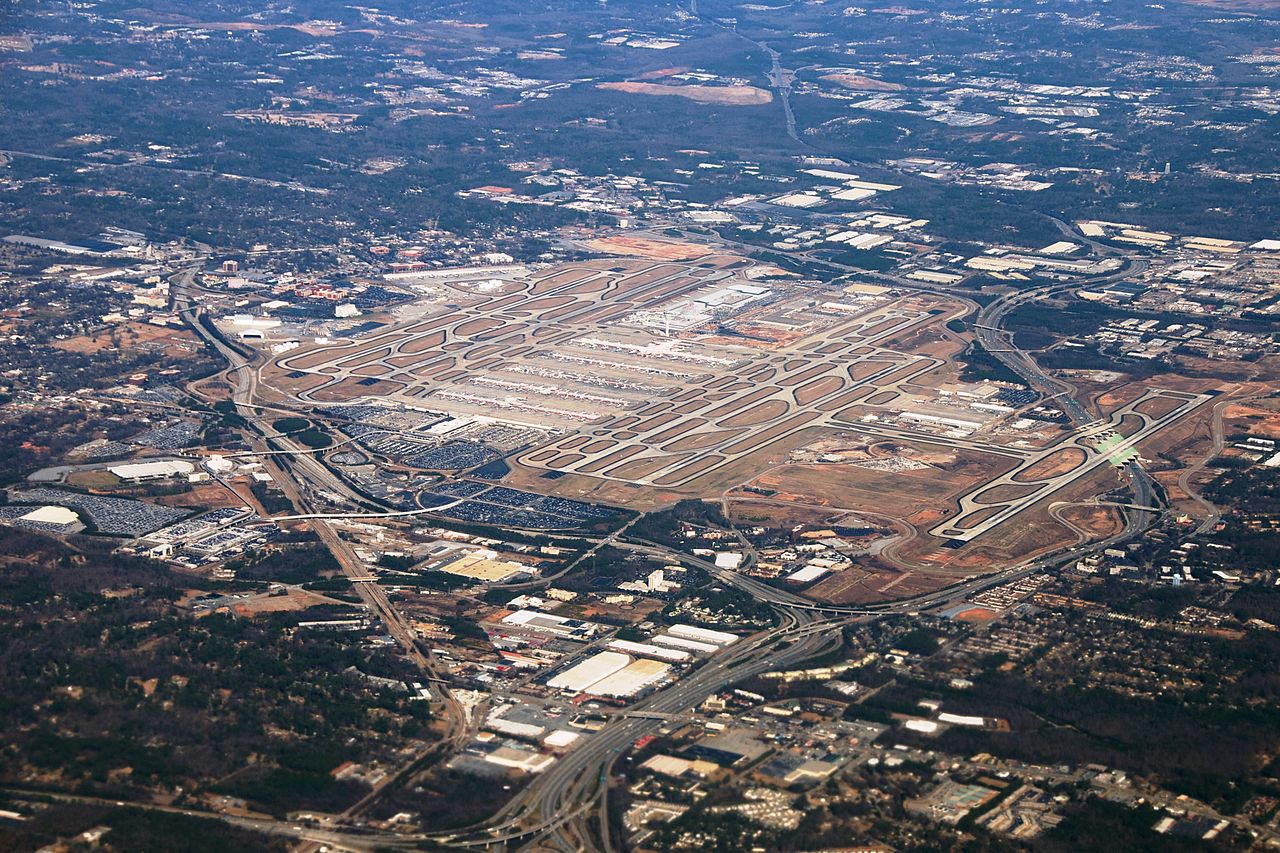
The world’s busiest airport in terms of passenger traffic was once again Atlanta’s (United States), with 93.69 million passengers moved during 2022, a variation of 23.8% compared to 2021. The next three positions also belong to US airports (Dallas/Fort Worth, Denver, and Chicago), while in the fifth position appears Dubai (DXB), with 66.6 million passengers (+127%). Madrid-Barajas appears in the 15th position (a leap from the 42nd position of 2021) with 50.6 million passengers (+109%), while Mexico City International Airport (MEX) is the only Latin American representative in the 20th position with 36.05 million passengers.
Top 20 airports with the most passenger traffic in 2022
| Pos 2022 | Pos 2021 | Airport | Country | 2022 | 2021 | Change |
|---|---|---|---|---|---|---|
| 1 | 1 | Atlanta (ATL) | United States | 93 699 630 | 75 704 760 | 23,8% |
| 2 | 2 | Dallas/Fort Worth (DFW) | United States | 73 362 946 | 62 465 756 | 17,5% |
| 3 | 3 | Denver (DEN) | United States | 69 286 461 | 58 828 552 | 17,8% |
| 4 | 4 | Chicago (ORD) | United States | 68 340 619 | 54 024 784 | 26,5% |
| 5 | 27 | Dubai (DXB) | United Arab Emirates | 66 069 981 | 29 110 609 | 127,0% |
| 6 | 5 | Los Angeles (LAX) | United States | 65 924 298 | 48 009 241 | 37,3% |
| 7 | 14 | Istanbul (IST) | Turkey | 64 289 107 | 36 988 067 | 73,8% |
| 8 | 54 | London (LHR) | United Kingdom | 61 614 230 | 19 395 287 | 217,7% |
| 9 | 13 | New Delhi (DEL) | India | 59 490 074 | 37 139 957 | 60,2% |
| 10 | 31 | Paris (CDG) | France | 57 474 033 | 26 196 575 | 119,4% |
| 11 | 25 | New York (JFK) | United States | 55 287 711 | 30 788 322 | 79,6% |
| 12 | 10 | Las Vegas (LAS) | United States | 52 694 312 | 39 754 366 | 32,6% |
| 13 | 34 | Amsterdam (AMS) | Netherlands | 52 472 188 | 25 492 633 | 105,8% |
| 14 | 12 | Miami (MIA) | United States | 50 684 396 | 37 302 456 | 35,9% |
| 15 | 42 | Madrid (MAD) | Spain | 50 602 864 | 24 121 350 | 109,8% |
| 16 | 32 | Tokyo (HND) | Japan | 50 334 354 | 26 169 812 | 92,3% |
| 17 | 7 | Orlando (MCO) | United States | 50 178 499 | 40 351 068 | 24,4% |
| 18 | 39 | Frankfurt (FRA) | Germany | 48 918 482 | 24 812 849 | 97,2% |
| 19 | 6 | Charlotte (CLT) | United States | 47 758 605 | 43 302 230 | 10,3% |
| 20 | 17 | Mexico City (MEX) | Mexico | 46 258 521 | 36 056 614 | 28,3% |
These 20 airports, ACI points out, represent 18% of global passenger traffic. 2022 was marked by the return of international traffic to some of the main hubs, with the share of that segment having climbed from 25.3% in 2021 to 38.4% in 2022.
Regarding aircraft movement, Atlanta also held the first position with 724,145 air operations during 2022 (+2.3%), followed by Chicago, Dallas/Fort Worth, Denver, and Las Vegas.
Top 20 airports with the most aircraft movement in 2022
| Pos 2022 | Pos 2021 | Airport | Country | 2022 | 2021 | Change |
|---|---|---|---|---|---|---|
| 1 | 1 | Atlanta (ATL) | United States | 724 145 | 707 661 | 2,3% |
| 2 | 2 | Chicago (ORD) | United States | 711 561 | 684 201 | 4,0% |
| 3 | 3 | Dallas/Fort Worth (DFW) | United States | 656 676 | 651 895 | 0,7% |
| 4 | 4 | Denver (DEN) | United States | 607 786 | 580 866 | 4,6% |
| 5 | 7 | Las Vegas (LAS) | United States | 581 116 | 486 540 | 19,4% |
| 6 | 6 | Los Angeles (LAX) | United States | 556 913 | 506 769 | 9,9% |
| 7 | 5 | Charlotte (CLT) | United States | 505 589 | 519 895 | -2,8% |
| 8 | 9 | Miami (MIA) | United States | 458 478 | 387 973 | 18,2% |
| 9 | 27 | New York (JFK) | United States | 448 847 | 290 778 | 55,4% |
| 10 | 33 | Istanbul (IST) | Turkey | 425 890 | 280 108 | 52,0% |
| 11 | 29 | Amsterdam (AMS) | Netherlands | 422 307 | 285 618 | 47,9% |
| 12 | 18 | New Delhi (DEL) | India | 421 479 | 327 429 | 28,7% |
| 13 | 8 | Phoenix (PHX) | United States | 418 856 | 408 285 | 2,6% |
| 14 | 45 | Paris (CDF) | France | 409 121 | 255 971 | 59,8% |
| 15 | 30 | Newark (EWR) | United States | 401 422 | 282 280 | 42,2% |
| 16 | 11 | Seattle (SEA) | United States | 401 351 | 374 510 | 7,2% |
| 17 | 10 | Houston (IAH) | United States | 399 805 | 395 787 | 1,0% |
| 18 | 38 | Tokyo (HND) | Japan | 388 104 | 274 248 | 41,5% |
| 19 | 17 | Mexico City (MEX) | Mexico | 387 450 | 327 889 | 18,2% |
| 20 | 43 | Frankfurt (FRA) | Germany | 382 211 | 261 927 | 45,9% |
The top 20 airports with the most aircraft movement represent 11.5% of global traffic.
Top 20 airports with the most cargo movement in 2022 (metric tonnes)
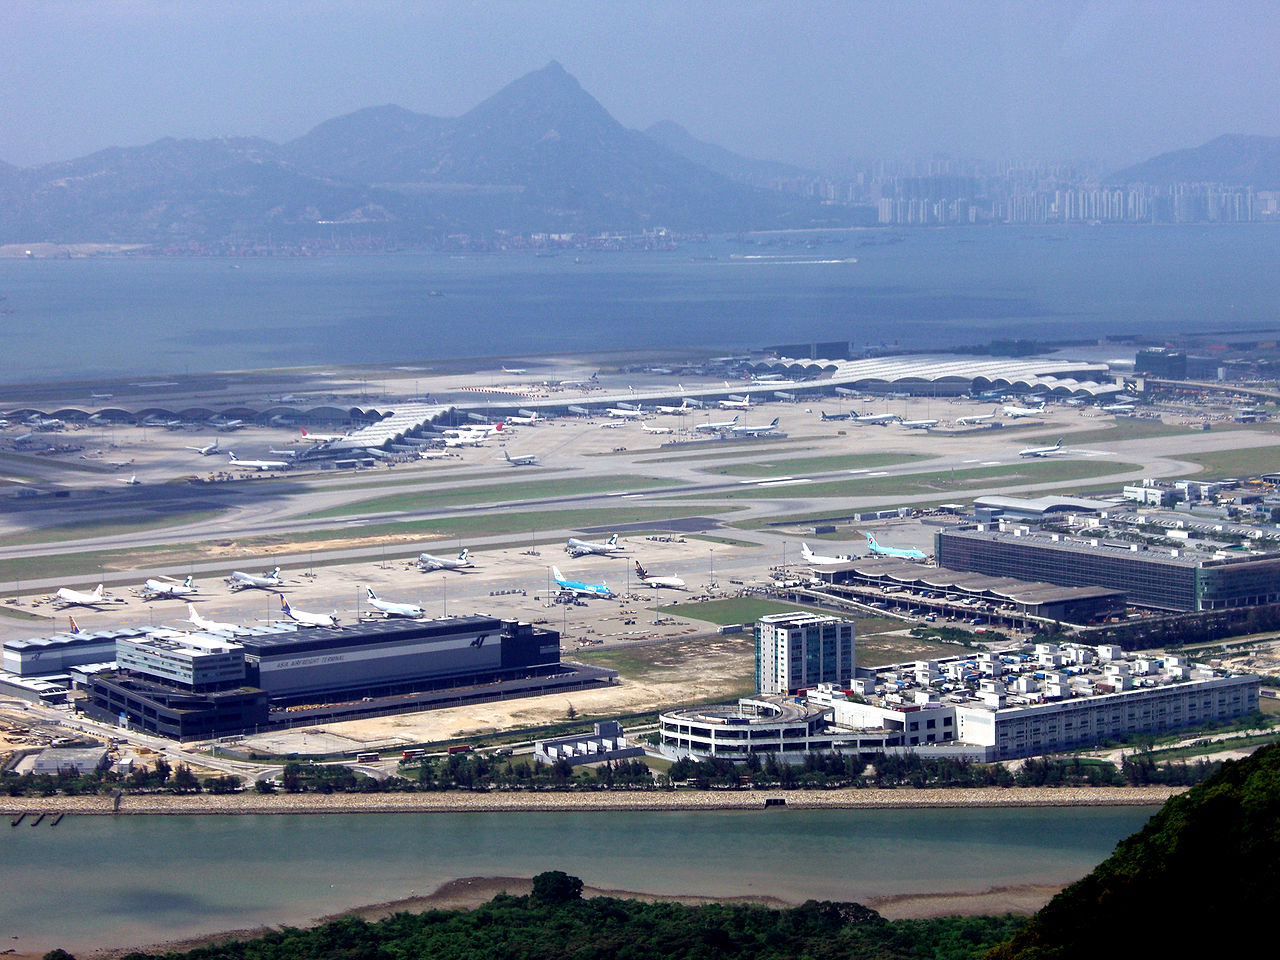
The top two positions among the airports with the most cargo traffic remained unchanged, with Hong Kong (HKG) leading followed by Memphis (MEM). Between the third and fourth position there was a swap between Anchorage (ANC) and Shanghai (PVG).
| Pos 2022 | Pos 2021 | Airport | Country | 2022 | 2021 | Change |
|---|---|---|---|---|---|---|
| 1 | 1 | Hong Kong (HKG) | China | 4 198 937 | 5 025 495 | -16,5% |
| 2 | 2 | Memphis (MEM) | United States | 4 042 679 | 4 482 327 | -9,8% |
| 3 | 4 | Anchorage (ANC) | United States | 3 462 874 | 3 654 347 | -5,2% |
| 4 | 3 | Shanghai (PVG) | China | 3 117 216 | 3 982 616 | -21,7% |
| 5 | 6 | Lousville (SDF) | United States | 3 067 234 | 3 052 269 | 0,5% |
| 6 | 5 | Incheon (ICN) | South Korea | 2 945 855 | 3 329 292 | -11,5% |
| 7 | 7 | Taipei (TPE) | Taiwan | 2 538 768 | 2812 065 | -9,7% |
| 8 | 12 | Miami (MIA) | United States | 2 499 837 | 2 520 859 | -0,8% |
| 9 | 8 | Los Angeles (LAX) | United States | 2 489 854 | 2 694 188 | -7,6% |
| 10 | 9 | Tokyo (NRT) | Japan | 2399 298 | 2 644 074 | -9,3% |
| 11 | 10 | Doha (DOH) | Qatar | 2 321 920 | 2620 095 | -11,4% |
| 12 | 11 | Chicago (ORD | United States | 2 235 709 | 2 536 576 | -11,9% |
| 13 | 14 | Fankfurt (FRA) | Germany | 1 967 450 | 2 274 969 | -13,5% |
| 14 | 15 | Paris (CDG) | France | 1925 571 | 2 062 433 | -6,6% |
| 15 | 16 | Guangzhou (CAN) | China | 1 884 784 | 2 044 909 | -7,8% |
| 16 | 17 | Singapore (SIN) | Singapore | 1 869 600 | 1 969 800 | -5,1% |
| 17 | 21 | Cincinnati (CVG) | United States | 1 794 451 | 1 536 998 | 16,8% |
| 18 | 13 | Dubai (DXB) | United Arab Emirates | 1 727 815 | 2319 185 | -25,5% |
| 19 | 19 | Leipzig (LEJ) | Germany | 1 509 098 | 1 588 815 | -5,0% |
| 20 | 20 | Shenchen (SZX) | China | 1 506 959 | 1 568 276 | -3,9% |
ACI points out that global cargo volume fell by 6.7% in 2022 compared to 2021, and 2.6% compared to 2019. This is attributed to geopolitical tensions, disruptions to global trade and supply chains.
The top 20 airports with the most cargo traffic accounted for 42% of the total volume.
«In the face of cost pressures and tight labor markets, the world’s airports continue to serve the public’s thirst to travel by air. Airports have once more proven their resiliency as reflected in the key findings from the ACI World Airport Traffic Dataset«, said Luis Felipe de Oliveira, General Director of ACI.

«As always, reliable data remains fundamental to our advocacy and development of timely airport guidance. Airports and aviation stakeholders must continue to focus wholeheartedly on building a safe, secure, efficient, and environmentally sustainable air transport system fit to welcome the doubling of passengers that will travel through our doors in the next two decades«, he concluded.
The World Airport Traffic Dataset report, which includes information from more than 2,600 airports in 180 countries and territories around the world, can be purchased on ACI’s website.
Para comentar, debés estar registradoPor favor, iniciá sesión